Fig. 6
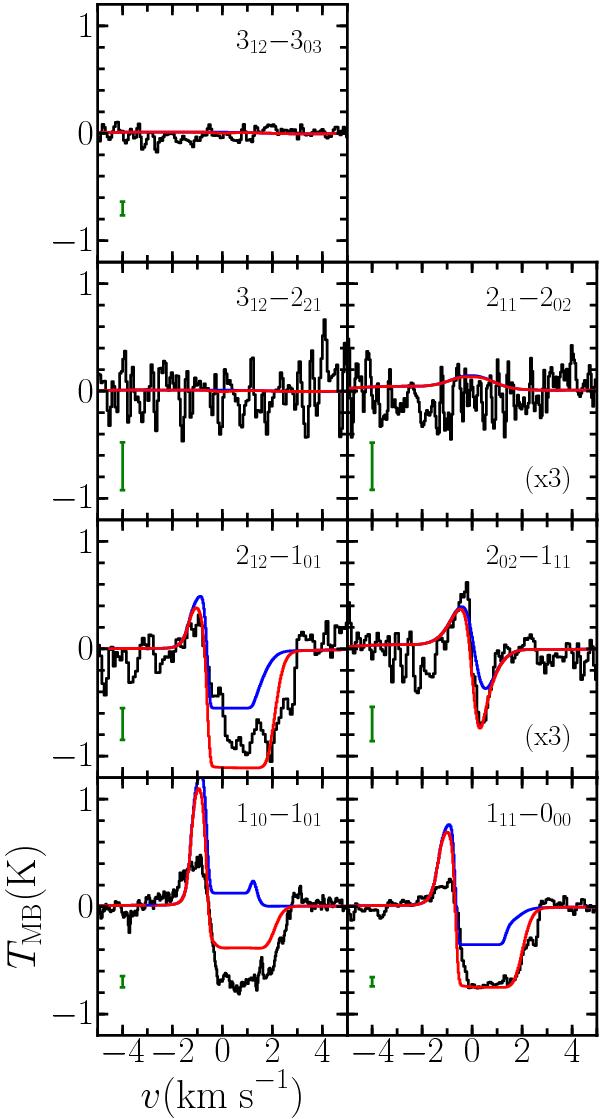
Comparison between the observed (black) and best-fit model H2O line profiles for IRAS4A both with (red) and without (blue) including absorption against the outflow and by foreground clouds as described in Sect. 3.5. The green error-bar in the lower left corner of each plot indicates the 1σrms uncertainty in the observations. For some lines, both the model and the data are scaled up by a factor indicated in the panel to aid comparison.
Current usage metrics show cumulative count of Article Views (full-text article views including HTML views, PDF and ePub downloads, according to the available data) and Abstracts Views on Vision4Press platform.
Data correspond to usage on the plateform after 2015. The current usage metrics is available 48-96 hours after online publication and is updated daily on week days.
Initial download of the metrics may take a while.