Fig. 5
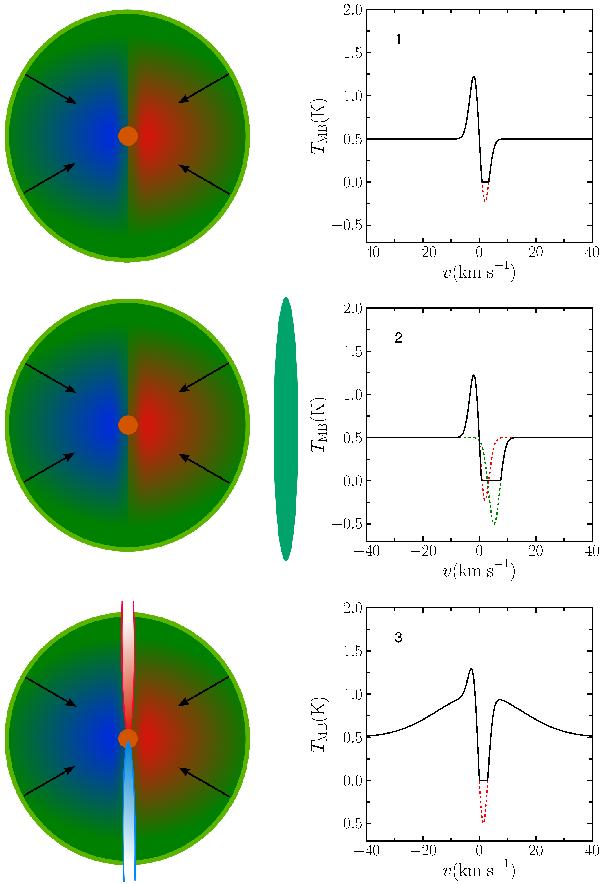
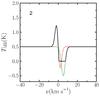
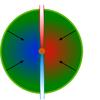
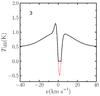
Cartoon showing a slice through the envelope structure (left) and the corresponding line profile if viewed from the right-hand side in the plane of the page (right). Top (case 1): an infalling envelope where the absorption is only against the continuum. The observed line profile is saturated (i.e. flattened at the bottom of the absorption) because the absorption removes all the continuum photons. The red dashed line shows what the absorption part of the profile would look like if the absorption did not saturate. Middle (case 2): a low-density foreground cloud is present, causing additional absorption which is likely offset from the source velocity, shown by the green dashed line. If this is close to the source velocity it will lead to the absorption being significantly wider than the envelope emission component, as is the case in IRAS4A (cf. Fig. 1). Bottom (case 3): outflow emission is added during ray-tracing in a plane at the centre of the envelope. The outer envelope can then absorb against both the continuum and the outflow, which may or may not lead to saturated absorption.
Current usage metrics show cumulative count of Article Views (full-text article views including HTML views, PDF and ePub downloads, according to the available data) and Abstracts Views on Vision4Press platform.
Data correspond to usage on the plateform after 2015. The current usage metrics is available 48-96 hours after online publication and is updated daily on week days.
Initial download of the metrics may take a while.