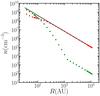
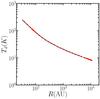
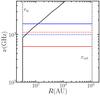
Fig. 3
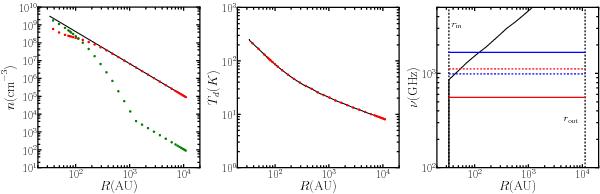
Left: density of H2 as a function of radius for IRAS4A. The black line indicates the density power-law from the dusty model, while the green and red points indicate the ortho and para-H2 densities respectively for each ratran cell. Middle: temperature as a function of radius for the same model as the left plot, where the black line is an interpolation on a fine grid from the dusty model and the red points are the temperatures for each ratran cell interpolated from the same model. Right: the radius of the continuum τ = 1 surface (black) as a function of frequency. The H2O 110 − 101 (solid red), 212 − 101 (solid blue), 111 − 000 (dashed red) and 202 − 111 (dashed blue) lines are all indicated with horizontal lines at the appropriate frequencies.
Current usage metrics show cumulative count of Article Views (full-text article views including HTML views, PDF and ePub downloads, according to the available data) and Abstracts Views on Vision4Press platform.
Data correspond to usage on the plateform after 2015. The current usage metrics is available 48-96 hours after online publication and is updated daily on week days.
Initial download of the metrics may take a while.