Free Access
Fig. 2
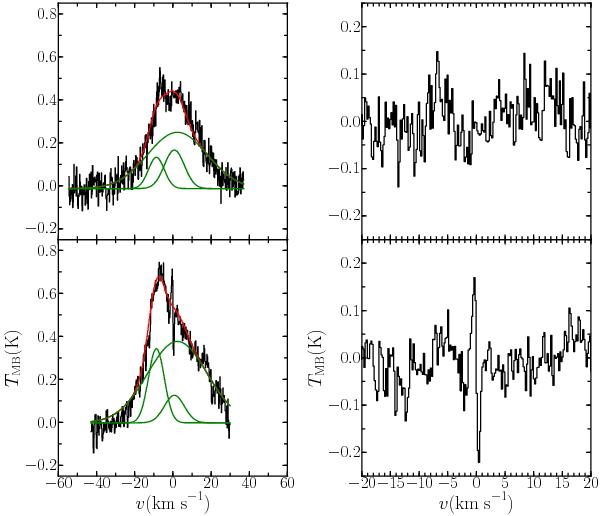
Left: HRS spectrum of H2O 211 −202 (top) and 202 −111 (bottom) for IRAS4A rebinned to 0.2 km s-1. The red and green lines have the same meaning as in Fig. 1. Right: residual to the fit over a narrower velocity range for emphasis.
This figure is made of several images, please see below:
Current usage metrics show cumulative count of Article Views (full-text article views including HTML views, PDF and ePub downloads, according to the available data) and Abstracts Views on Vision4Press platform.
Data correspond to usage on the plateform after 2015. The current usage metrics is available 48-96 hours after online publication and is updated daily on week days.
Initial download of the metrics may take a while.