Fig. 11
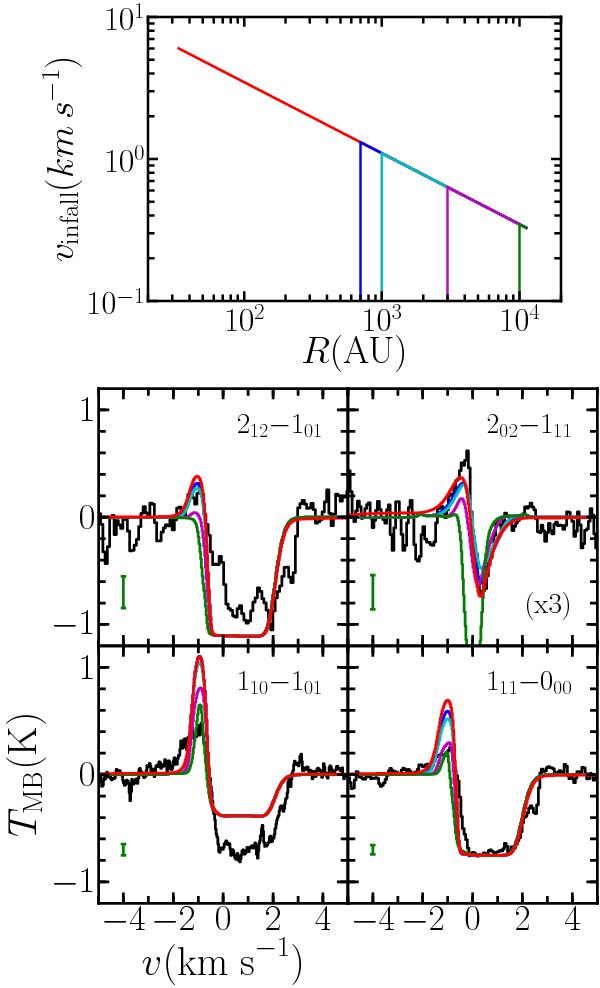
Top: velocity profile for the best-fit model for IRAS4A (red), and those with the infall stopped inside 700 (blue), 1000 (cyan), 3000 (magenta) and 10 000 AU (green). Outside the stop radius the infall profile is the same as in the best-fit model. Bottom: comparison of resulting line profiles for these different velocity profiles. The green error bar and scaling factors are the same as in Fig. 6.
Current usage metrics show cumulative count of Article Views (full-text article views including HTML views, PDF and ePub downloads, according to the available data) and Abstracts Views on Vision4Press platform.
Data correspond to usage on the plateform after 2015. The current usage metrics is available 48-96 hours after online publication and is updated daily on week days.
Initial download of the metrics may take a while.