Free Access
Fig. 10
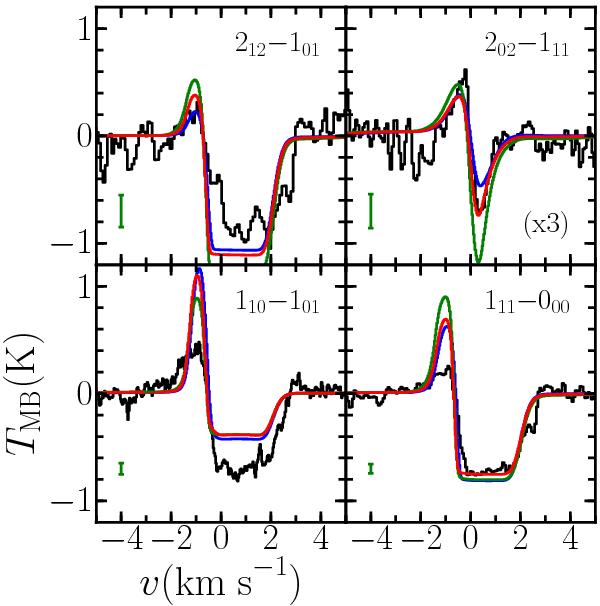
Comparison of model H2O line profiles for IRAS4A between the best-fit source model (red) and ones with a density power-law index (p) of 1.5 (blue) and 2.0 (green). All other variables take the best-fit values and are held constant. The green error bar and scaling factors are the same as in Fig. 6.
Current usage metrics show cumulative count of Article Views (full-text article views including HTML views, PDF and ePub downloads, according to the available data) and Abstracts Views on Vision4Press platform.
Data correspond to usage on the plateform after 2015. The current usage metrics is available 48-96 hours after online publication and is updated daily on week days.
Initial download of the metrics may take a while.