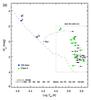
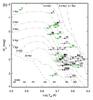
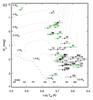
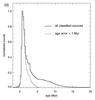
Fig. 9

a) Hertzsprung-Russell diagram including sources in the SINFONI field of view. The MK value of object 2 is corrected for its intrinsic infrared excess. b) and c) Detail of a), with PMS isochrones (dash-dotted lines) and evolutionary tracks (dotted lines) taken from Da Rio et al. (2009), calculated from the evolutionary models of Siess et al. (2000). Spectral types are indicated following the observational calibrations by Martins & Plez (2006, O stars) and Kenyon & Hartmann (1995, KH95, B0 and later). d) Age distribution of the classified stars (see text). The distribution peaks at 1.1 ± 0.6 Myr. When only considering sources with errors <1 Myr, the “tail” towards older ages disappears.
Current usage metrics show cumulative count of Article Views (full-text article views including HTML views, PDF and ePub downloads, according to the available data) and Abstracts Views on Vision4Press platform.
Data correspond to usage on the plateform after 2015. The current usage metrics is available 48-96 hours after online publication and is updated daily on week days.
Initial download of the metrics may take a while.