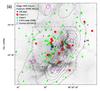
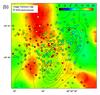
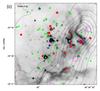
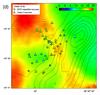
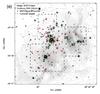
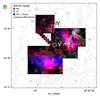
Fig. 4

a) Map of RCW 36; the same symbols as in Fig. 2 are used to classify the stellar population. Purple circles are the protostellar cores from MTHM13; according to these authors, core 1 contains over 20 M⊙. The cyan cross marks the location of the UCHII (Walsh et al. 1998, W98). The SPIRE 500 μm contours are overplotted. b) Extinction map based on the JHKs colors of individual stars (see text). The SOFI point sources are color-coded with their extinction values, overlain on the spatially smoothed extinction map. c) Same as a), zoom in on boxed region. d) Same as b), zoom in on boxed region. Symbols indicate the classified stars, color-coded with their extinction values obtained by spectral classification. e) Map showing the targets of which a spectrum was obtained and classified. f) SINFONI three-color linemap showing the different ionization properties of the nebula. Regions I–V (see text) are indicated. The symbols used in a), b) represent all classified sources; in c) all SOFI detections and d) only sources with a spectral classification. Figures a)–b) and c)–f) have the same scale, respectively.
Current usage metrics show cumulative count of Article Views (full-text article views including HTML views, PDF and ePub downloads, according to the available data) and Abstracts Views on Vision4Press platform.
Data correspond to usage on the plateform after 2015. The current usage metrics is available 48-96 hours after online publication and is updated daily on week days.
Initial download of the metrics may take a while.