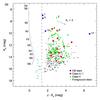
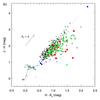
Fig. 2

a) (J − Ks,Ks) color–magnitude diagram. b) (H − Ks, J − H) color–color diagram. All detections in the SOFI-field of view (Fig. 1, bottom right) are included, except for those with an error larger than 0.1 mag in any of the color indices. Blue symbols indicate OB stars (see Sect. 4.1); red (Class 0/I) and green (Class II) symbols indicate Lada classified sources (see Sect. 3.2). The solid line is the zero-age main sequence (ZAMS, Blum et al. 2000; Bessell & Brett 1988) at a distance of 0.7 kpc. The dashed line indicates the separation between the cluster and the foreground population, which is indicated with cyan symbols. The dotted line is the extinction vector (Cardelli et al. 1989) and the dot-dashed line is the cTTS locus (Meyer et al. 1997).
Current usage metrics show cumulative count of Article Views (full-text article views including HTML views, PDF and ePub downloads, according to the available data) and Abstracts Views on Vision4Press platform.
Data correspond to usage on the plateform after 2015. The current usage metrics is available 48-96 hours after online publication and is updated daily on week days.
Initial download of the metrics may take a while.