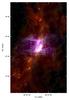
Fig. 1

Left: Herschel image (Hill et al. 2011) of RCW 36 and its surroundings (blue: PACS 70 μm, green: PACS 160 μm, red: SPIRE 250 μm). The cluster is located on a filamentary cloud structure that extends north to south; perpendicular to this ridge a bipolar nebula is seen. Note the ring-shaped structure in the center of this nebula. The dashed square denotes the region covered by Spitzer. Top right: Spitzer/IRAC image of RCW 36 and its surroundings (blue: 3.6 μm, green: 4.5 + 5.8 μm, red: 8.0 μm, logarithmic scale). The dashed square denotes the region covered by NTT/SOFI. Bottom right: NTT/SOFI broadband three-color image (blue: J, green: H, red: Ks). The region delimited by the solid red lines is covered by the VLT/SINFONI observations. The blue cross denotes the peak location of the 5 GHz radio continuum source (Walsh et al. 1998).
Current usage metrics show cumulative count of Article Views (full-text article views including HTML views, PDF and ePub downloads, according to the available data) and Abstracts Views on Vision4Press platform.
Data correspond to usage on the plateform after 2015. The current usage metrics is available 48-96 hours after online publication and is updated daily on week days.
Initial download of the metrics may take a while.