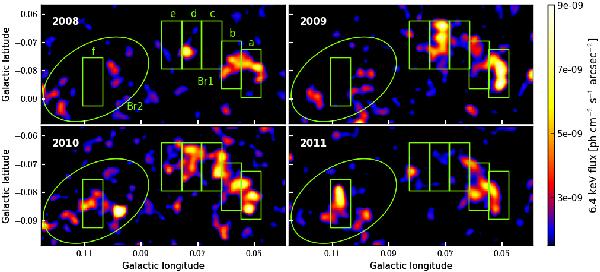
Fig. 6

Fe Kα flux mosaics showing the evolution of the Bridge region from 2008 to 2011. Br1 is divided into five subregions named from a (west) to e (east). This region becomes brighter from 2008 to 2010. In 2011, the eastern part of Br1 is mainly off and the Br2 region gets very bright (box f). The exact illuminated region of Br2 is shown in Figure 5 and appears larger here because it is smoothed to 4 arcsec.
Current usage metrics show cumulative count of Article Views (full-text article views including HTML views, PDF and ePub downloads, according to the available data) and Abstracts Views on Vision4Press platform.
Data correspond to usage on the plateform after 2015. The current usage metrics is available 48-96 hours after online publication and is updated daily on week days.
Initial download of the metrics may take a while.


