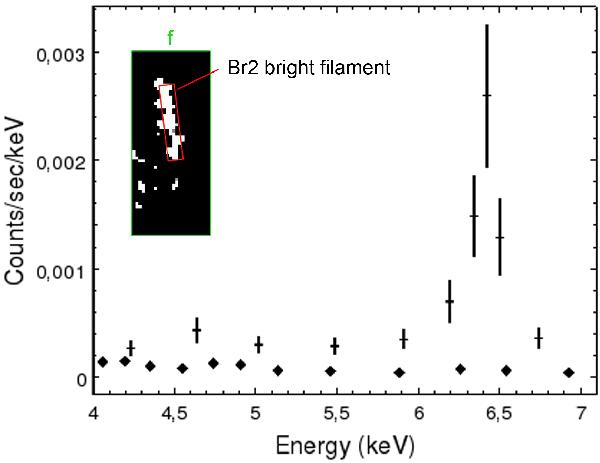
Fig. 5

The 2011 Br2 bright filament. The Fe Kα flux map in the upper left corner is a zoom on region f which is defined in Fig. 6. Here the map has not been smoothed and shows the exact dimension of the bright illumination detected in 2011. Both spectra presented on this figure are extracted from the region highlighted by the red rectangle. The 2011 spectrum shows an Fe Kα emission line at 6.4 keV (crosses), while the 2000 to 2010 spectrum (diamonds) shows no excess at this energy. Notice that due to better statistics the error bars of the 2000–2010spectrum are not larger than the diamond size. The 2011 spectrum subtracted from the 2000–2010 one is fitted over the 4−7.1 keV energy range ( ): the Fe Kα line intensity is (3.2 ± 0.6) × 10-6 ph cm-2 s-1 and the equivalent width is more than 2 keV, suggesting a higher metallicity than previously anticipated.
Current usage metrics show cumulative count of Article Views (full-text article views including HTML views, PDF and ePub downloads, according to the available data) and Abstracts Views on Vision4Press platform.
Data correspond to usage on the plateform after 2015. The current usage metrics is available 48-96 hours after online publication and is updated daily on week days.
Initial download of the metrics may take a while.


