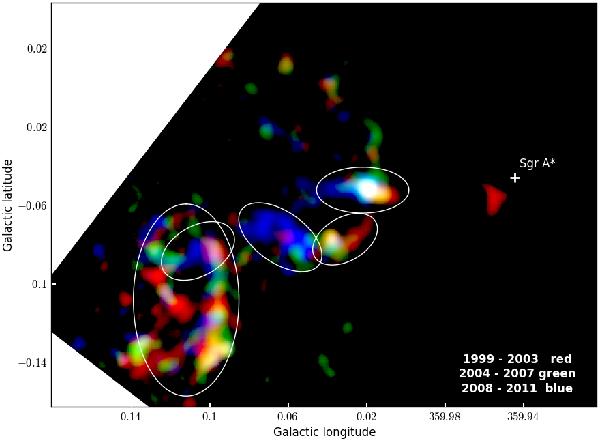
Fig. 4

Fe Kα flux mosaics smoothed to 9 arcsec. (Red) Chandra data from 1999 to 2003 (only observation 3392 has been kept among 2002 observations); (green) Mosaic map from 2004 to 2007; (blue) Mosaic map from 2008 to 2011. The emission has been strongly varying in the Sgr A complex with a clear trend from west to east in MC1 and MC2, a late illumination of Br1 and Br2, and more complex variations in G0.11-0.11. We assume Br2 emission is only associated with the blue patch at the center of the region, the rest being mostly due to the underlying G0.11-0.11 cloud.
Current usage metrics show cumulative count of Article Views (full-text article views including HTML views, PDF and ePub downloads, according to the available data) and Abstracts Views on Vision4Press platform.
Data correspond to usage on the plateform after 2015. The current usage metrics is available 48-96 hours after online publication and is updated daily on week days.
Initial download of the metrics may take a while.


