Fig. 13
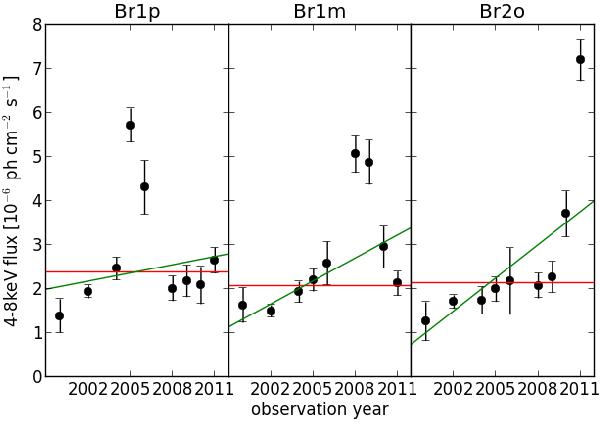
4 to 8 keV lightcurves of different 15-arcsec-square regions in Br1 or Br2, overlaid with constant (red) and linear (green) fits. The exact positions of these regions are given in Fig. 10. The fast variations seen in these regions are poorly fitted by the linear regression.
Current usage metrics show cumulative count of Article Views (full-text article views including HTML views, PDF and ePub downloads, according to the available data) and Abstracts Views on Vision4Press platform.
Data correspond to usage on the plateform after 2015. The current usage metrics is available 48-96 hours after online publication and is updated daily on week days.
Initial download of the metrics may take a while.