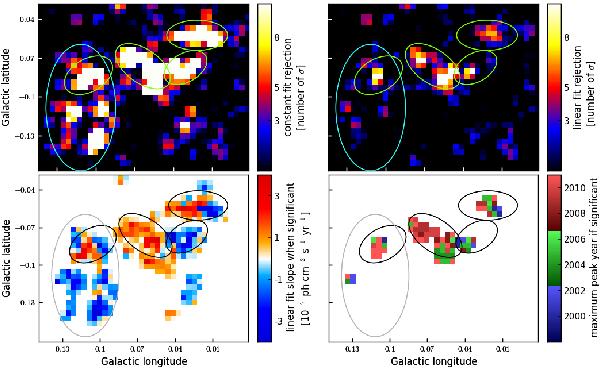
Fig. 11

Information maps derived from the 4 to 8 keV flux lightcurve analysis. The main point sources have been removed before the analysis. Probabilities displayed in the two top maps are combined to a scale of 30 arcsec and represent: (top left) post trial rejection of a constant fit in number of sigma; (top right) post trial rejection of a linear fit in number of sigma. In the two bottom maps are plotted: (bottom left) the linear fit slope of the lightcurve if the constant fit is rejected at more than 5σ, zero otherwise; (bottom right) the year corresponding to the lightcurve’s maximum value when the linear fit is rejected at more than 5σ. From these figures we see that variations are correlated between nearby regions and are either linear (MC1, MC2 and G0.11-0.11) or not (Br1 and Br2). Moreover, both linear fit slope and peak year characterizations highlight an apparent signal propagation from right (decreasing) to left (increasing).
Current usage metrics show cumulative count of Article Views (full-text article views including HTML views, PDF and ePub downloads, according to the available data) and Abstracts Views on Vision4Press platform.
Data correspond to usage on the plateform after 2015. The current usage metrics is available 48-96 hours after online publication and is updated daily on week days.
Initial download of the metrics may take a while.


