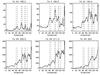
Fig. 9
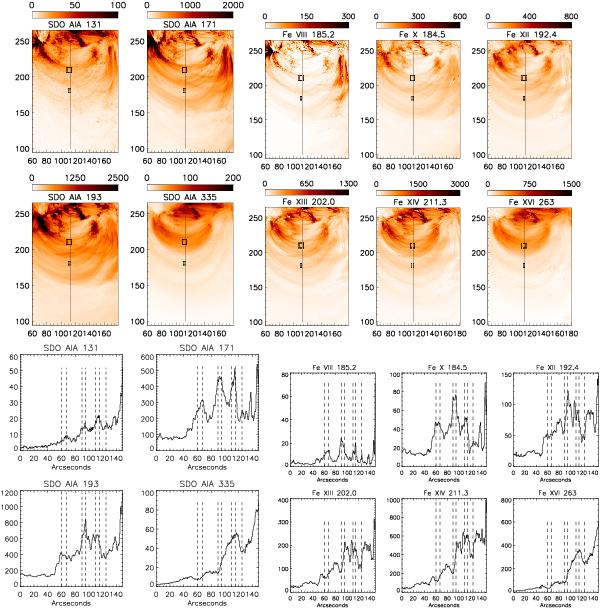
Top left: full-resolution AIA images of the 2010 Oct. 26 active region. The two selected regions are shown (the larger on the 3 MK loops, the smaller for the background), as well as a cut across the 3 MK loops. Top right: the corresponding radiances in a few EIS lines, predicted from the AIA DEM modelling. Below: profiles of the count rates and radiances across the 3 MK loops.
Current usage metrics show cumulative count of Article Views (full-text article views including HTML views, PDF and ePub downloads, according to the available data) and Abstracts Views on Vision4Press platform.
Data correspond to usage on the plateform after 2015. The current usage metrics is available 48-96 hours after online publication and is updated daily on week days.
Initial download of the metrics may take a while.