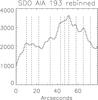
Fig. 8
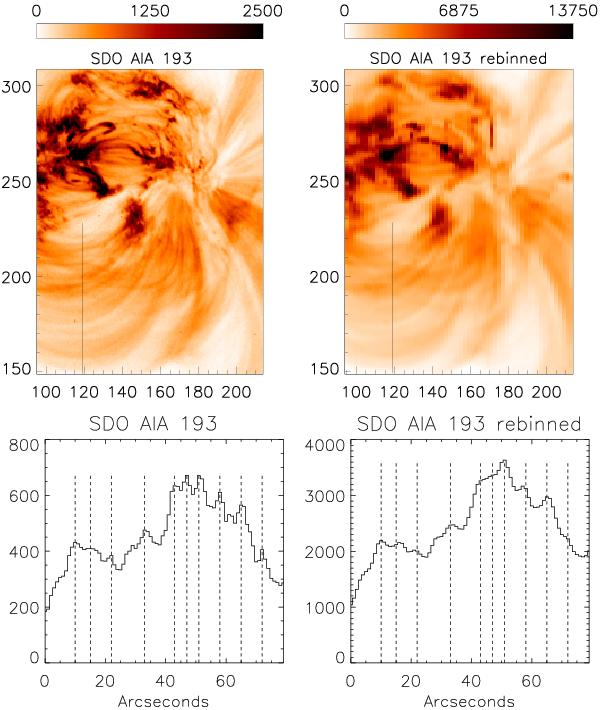
Above: zoom up of a full-resolution AIA 193 Å image (left, negative, at 11:40 UT) of the 2010 Oct. 26 active region within the EIS FOV, and the corresponding rebinned image obtained by converting the AIA observations into the EIS spatial and temporal resolution (right, negative). Below: profiles of the count rates along the N-S segment shown in the images. The locations of a few loop structures that appear as nearly resolved in the full-resolution AIA 193 Å image are indicated with dashed lines.
Current usage metrics show cumulative count of Article Views (full-text article views including HTML views, PDF and ePub downloads, according to the available data) and Abstracts Views on Vision4Press platform.
Data correspond to usage on the plateform after 2015. The current usage metrics is available 48-96 hours after online publication and is updated daily on week days.
Initial download of the metrics may take a while.