Fig. 5
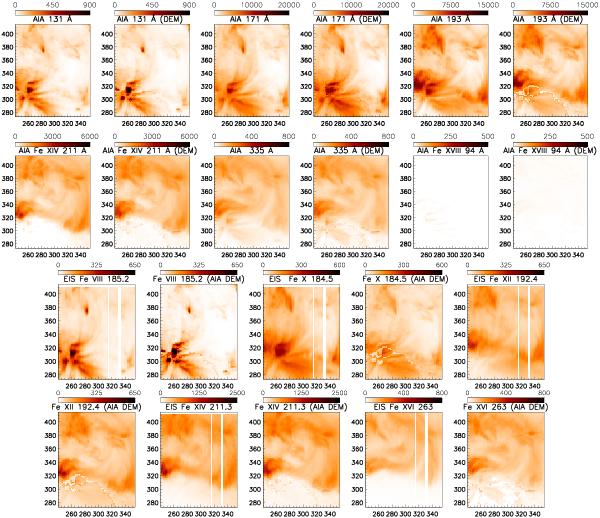
Top two rows: observed and estimated (from the AIA DEM modelling) AIA images (negative, DN/s) of the on-disk AR observation of 2010 Nov. 23, rebinned to the EIS resolution. Lower two rows: monochromatic images (negative, photons cm-2 s-1 arcsec-2) in EIS lines, observed and estimated from the AIA DEM modelling.
Current usage metrics show cumulative count of Article Views (full-text article views including HTML views, PDF and ePub downloads, according to the available data) and Abstracts Views on Vision4Press platform.
Data correspond to usage on the plateform after 2015. The current usage metrics is available 48-96 hours after online publication and is updated daily on week days.
Initial download of the metrics may take a while.