Fig. 2
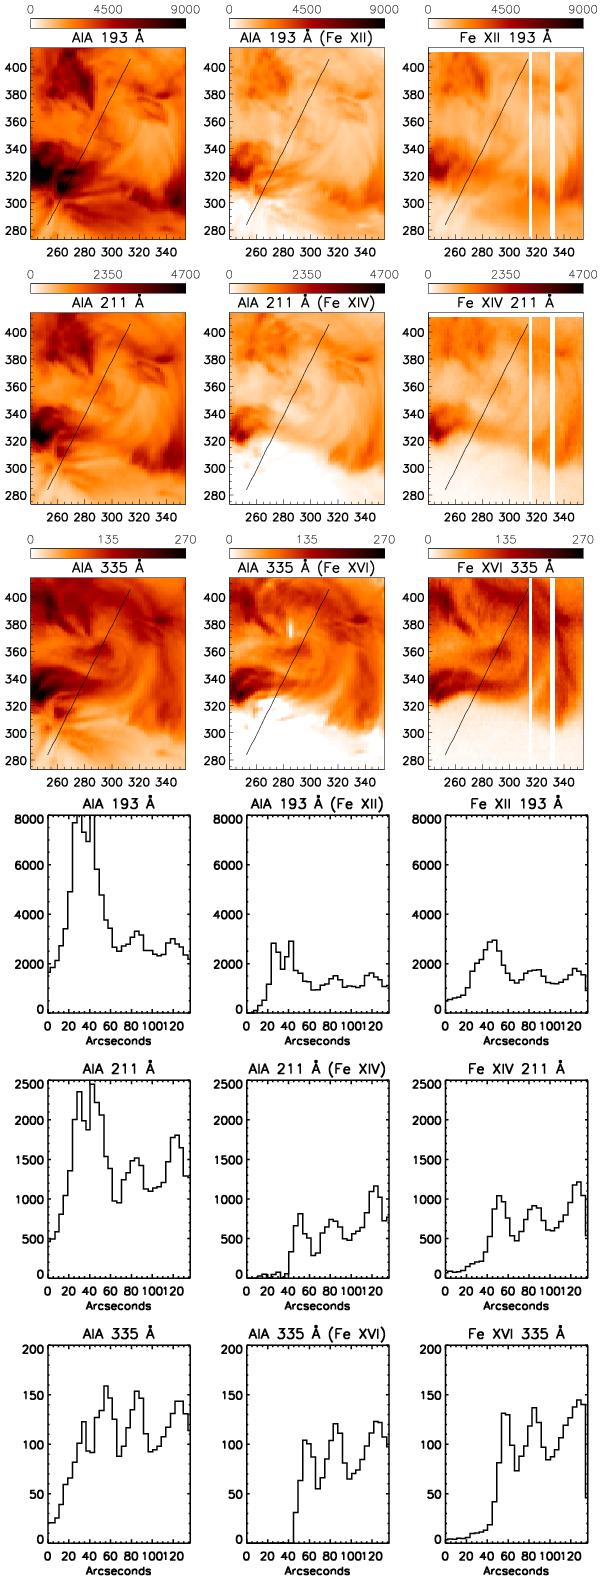
Top three left images: AIA count rates (DN/s) of the on-disk AR observation of 2010 Nov. 23, rebinned to the EIS resolution. Top three middle images: estimated AIA count rates due to Fe xii, Fe xiv, and Fe xvi (see text). Top three right images: measured Fe xii, Fe xiv and estimated Fe xvi (in AIA DN/s) directly from EIS. The axes in the images indicate arc seconds from Sun centre. The bottom panels show the corresponding profiles (AIA DN/s) along the segment indicated in the images. The AR core spans the 60–130 arcsec region in the profiles.
Current usage metrics show cumulative count of Article Views (full-text article views including HTML views, PDF and ePub downloads, according to the available data) and Abstracts Views on Vision4Press platform.
Data correspond to usage on the plateform after 2015. The current usage metrics is available 48-96 hours after online publication and is updated daily on week days.
Initial download of the metrics may take a while.