Free Access
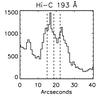
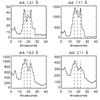
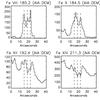
Fig. 15
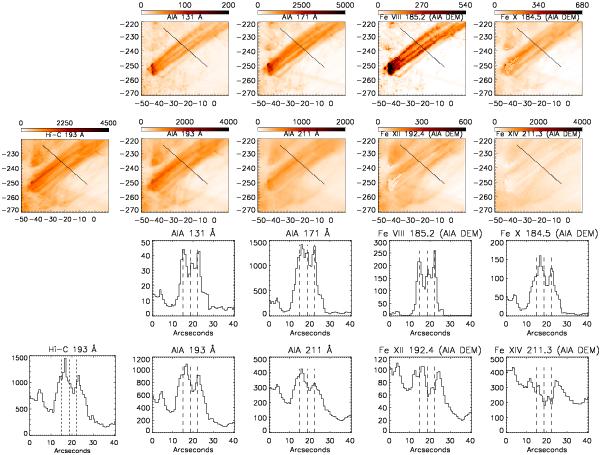
Above: region R3, as observed Hi-C, by AIA, and as predicted from the AIA DEM modelling. Below: profiles (averages over 1.8′′ in DN/s) along the segment indicated in the images. The positions of a few cool loops are noted with dashed lines.
This figure is made of several images, please see below:
Current usage metrics show cumulative count of Article Views (full-text article views including HTML views, PDF and ePub downloads, according to the available data) and Abstracts Views on Vision4Press platform.
Data correspond to usage on the plateform after 2015. The current usage metrics is available 48-96 hours after online publication and is updated daily on week days.
Initial download of the metrics may take a while.