Fig. 4
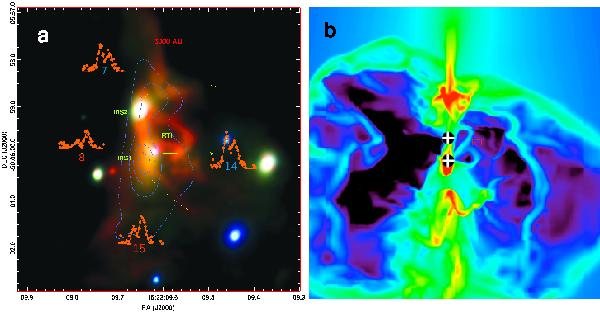
a) Near-infrared H-, Brγ-, and L′-band adaptive optics data coded in blue, green, and red respectively to produce the colour composite of the brightest part of the ultra-compact HII region G333.6-0.2. Blue dashed contours depict 18 μm emission revealing the source IRS 1. H90α recombination-line double-peaked spectra from Fujiyoshi et al. (2006) are overplotted. The numbers below these spectra correspond to the numbering in the original paper (see their Figs. 4 and 5). The thin orange line sketch represents possible margin of the outflow bubble. b) Simulations of a forming massive star system from Krumholz et al. (2009) showing 3000 AU × 3000 AU region at 41 700 years, where the colours represent volume densities. The disk plane and outflow axis are aligned vertically and horizontally.
Current usage metrics show cumulative count of Article Views (full-text article views including HTML views, PDF and ePub downloads, according to the available data) and Abstracts Views on Vision4Press platform.
Data correspond to usage on the plateform after 2015. The current usage metrics is available 48-96 hours after online publication and is updated daily on week days.
Initial download of the metrics may take a while.