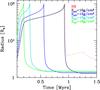
Fig. 1
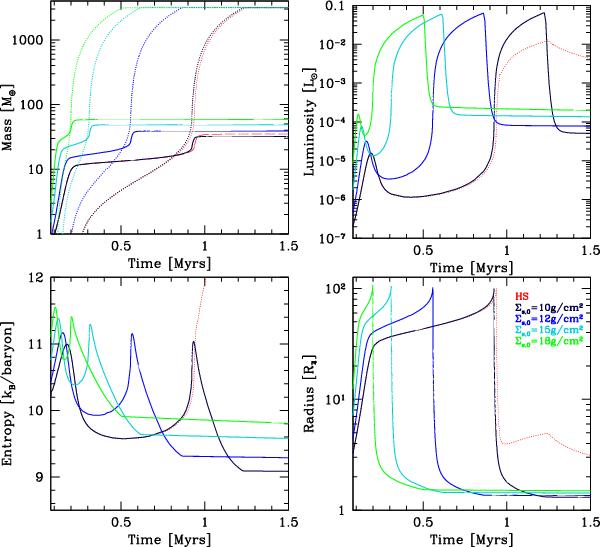
Formation and early evolution of 10 M♃ planets forming at 5.2 AU. The thin red line is for hot accretion (HS). The remaining four cases are all for cold accretion, but differ in the initial planetesimal surface density Σs,0 as indicated in the plot. The top left panel shows the core (solid) and total mass (dotted lines). The top right panel shows the total luminosity. The bottom left and right panels are the specific entropy at the core-envelope boundary, and the outer radius, respectively. Note how the luminosity, entropy and radius at the end of the formation phase increase with core mass for cold accretion.
Current usage metrics show cumulative count of Article Views (full-text article views including HTML views, PDF and ePub downloads, according to the available data) and Abstracts Views on Vision4Press platform.
Data correspond to usage on the plateform after 2015. The current usage metrics is available 48-96 hours after online publication and is updated daily on week days.
Initial download of the metrics may take a while.