Fig. 7
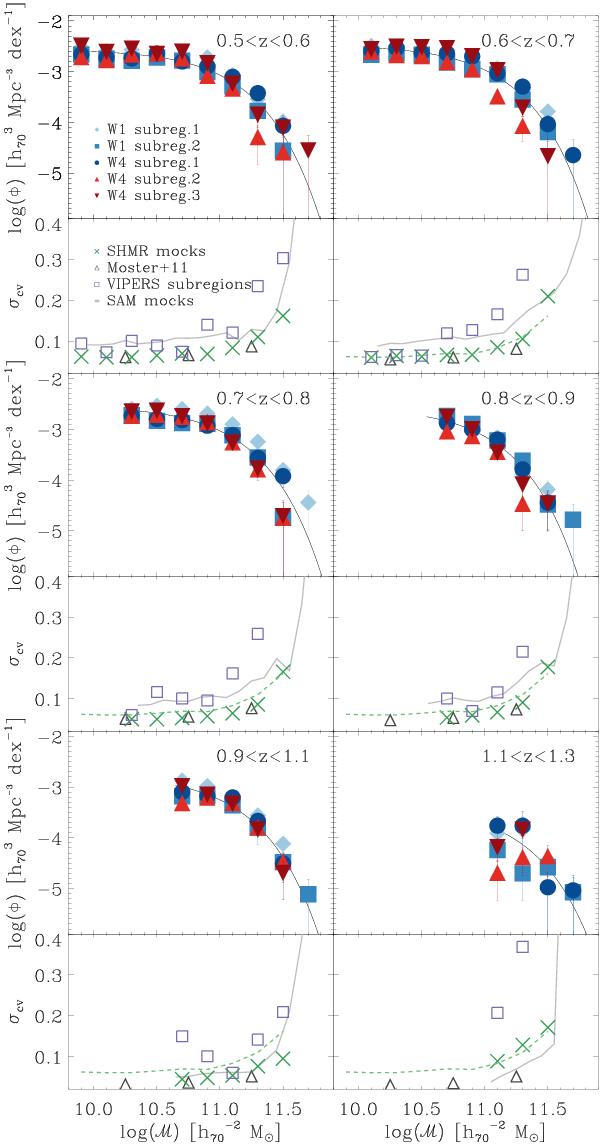
Estimates of the contribution of sample (cosmic) variance to the statistical uncertainty of the GSMF measurements. For each redshift bin, the upper panels show the GSMF 1/Vmax measurements obtained from five VIPERS subregions of 2 deg2, located respectively in the W1 field (three regions, blue diamonds, circles, and squares) and in the W4 field (two regions, red triangles, and downward triangles). The Schechter fit to the global GSMF of Fig. 5 is shown as reference (black solid line). The lower panels show the standard deviations estimated in each redshift bin from these five measurements (purple squares, Eq. (3)), together with the estimates of σcv obtained from 57 SHMR mocks by means of Eq. (2) (green crosses). To highlight how the effect of cosmic variance decreases at higher z, we report σcv,SHMR of the first redshift bin in the other panels (green dashed lines). In addition, the sample variance measured in 50 SAM mocks (grey solid line) and the estimates provided by Moster et al. (2011) method (black triangles) are shown as reference.
Current usage metrics show cumulative count of Article Views (full-text article views including HTML views, PDF and ePub downloads, according to the available data) and Abstracts Views on Vision4Press platform.
Data correspond to usage on the plateform after 2015. The current usage metrics is available 48-96 hours after online publication and is updated daily on week days.
Initial download of the metrics may take a while.