Fig. 5
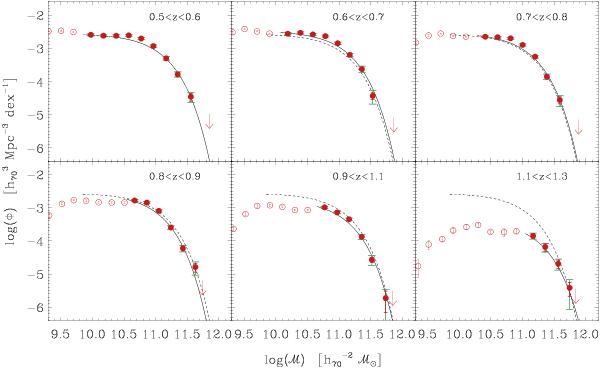
VIPERS galaxy stellar mass function at different redshifts. Circles give the values determined through 1/Vmax in mass bins of Δℳ = 0.2 dex; the centre of each bin corresponds to the weighted mean mass of the objects within it. Empty and filled symbols correspond to values below and above the completeness limit, respectively (see Sect. 3.1). For the latter points, the red error bars show the uncertainty due to Poisson noise, while green bars account for Poisson noise and cosmic variance. In each panel, a solid line shows the Schechter best-fit to the GSMF filled points, with the dashed line reproducing that of the first redshift bin, as a reference. The downward arrows give an upper limit to Φ where no detection is available.
Current usage metrics show cumulative count of Article Views (full-text article views including HTML views, PDF and ePub downloads, according to the available data) and Abstracts Views on Vision4Press platform.
Data correspond to usage on the plateform after 2015. The current usage metrics is available 48-96 hours after online publication and is updated daily on week days.
Initial download of the metrics may take a while.