Fig. 13
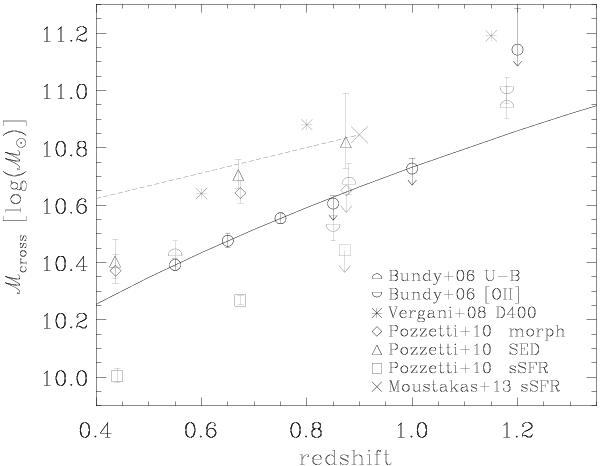
Values of the transition mass ℳcross as computed from Fig. 12, plotted as a function of redshift. The VIPERS measurements are given as black open circles, with a downward arrow when the transition mass is below the completeness mass of at least one of the two classes. The solid line is a fit with a (1 + z)3 power law to the VIPERS points between z = 0.5 and z = 0.8. These are compared to literature estimates in grey. Points from Pozzetti et al. (2010) are obtained using three different classifications: a separation according to specific SFR (diamonds), a best-fit SED classification (triangles), and a morphological classification (squares). The points of Bundy et al. (2006) are based on either the (U − B) bimodality or [OII] emission (upper and lower half-circles respectively). The points by Vergani et al. (2008) (asterisks) are based on a spectral classification (D4000 break). The value from PRIMUS (Moustakas et al. 2013) at z = 0.9 is reported as a cross, while the dashed line traces an evolution ∝ (1 + z)1.5, as suggested in that paper; these authors classified active and quiescent galaxies with respect to their position in the SFR vs. ℳ diagram.
Current usage metrics show cumulative count of Article Views (full-text article views including HTML views, PDF and ePub downloads, according to the available data) and Abstracts Views on Vision4Press platform.
Data correspond to usage on the plateform after 2015. The current usage metrics is available 48-96 hours after online publication and is updated daily on week days.
Initial download of the metrics may take a while.