Fig. 11
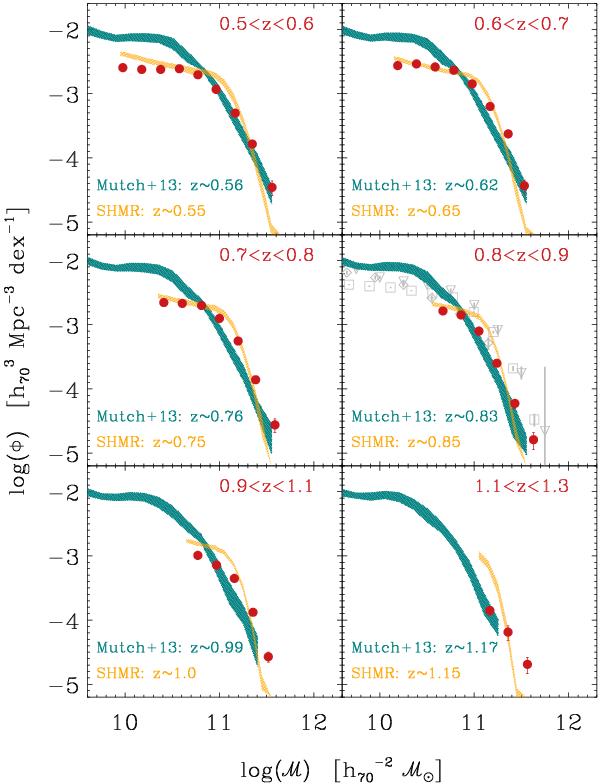
Comparison of the VIPERS mass function (red points) with the semi-analytical model of Mutch et al. (2013) (green shaded area at 95% confidence limits). In several redshift bins Mutch et al. GSMF does not reach masses as high as VIPERS because the volume of the simulation (with a comoving box size  ) is smaller. In the right-hand middle panel (0.8 < z < 0.9), a grey dashed line represents the mass function that Mutch et al. obtain by combining observational data from three different surveys (Pozzetti et al. 2007; Drory et al. 2009; Ilbert et al. 2010, grey triangles, diamonds, and squares, respectively). In addition, the yellow shaded regions represent the dispersion of the mass functions derived from the 57 SHMR mocks (see Sect. 3.3), in the same redshift bins as the VIPERS ones.
Current usage metrics show cumulative count of Article Views (full-text article views including HTML views, PDF and ePub downloads, according to the available data) and Abstracts Views on Vision4Press platform.
Data correspond to usage on the plateform after 2015. The current usage metrics is available 48-96 hours after online publication and is updated daily on week days.
Initial download of the metrics may take a while.