Fig. 3
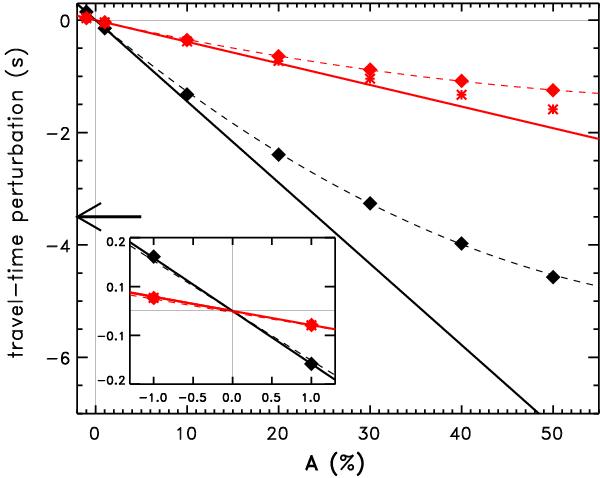
Travel-time perturbations versus sound-speed perturbation amplitudes A, for p1 wave packets. The results from two SLiM numerical experiments are shown. In the first procedure, the red diamonds show the travel-time perturbations resulting from sound-speed perturbations to a background model that includes the reference sunspot, ⟨ ΔQSτ(RS + δc) ⟩ − ⟨ ΔQSτ(RS) ⟩. In the second procedure, the black diamonds show the travel-time perturbations resulting from the same sound-speed perturbations to a quiet-Sun background model, ⟨ ΔQSτ(QS + δc) ⟩. In both experiments, the travel times (diamonds) are measured using sliding quiet-Sun waveforms. For the first experiment, the red asterisks show the results using a different measurement procedure, ⟨ ΔRSτ(RS + δc) ⟩. The solid lines show linear fits to the three smallest perturbations with A = −1%, 0, and 1%. The inset shows a zoom around the origin of the plot. The dashed curves are parabolic fits. The p1 travel-time noise level for 7 days of observation is 3.5 s as indicated by the arrow.
Current usage metrics show cumulative count of Article Views (full-text article views including HTML views, PDF and ePub downloads, according to the available data) and Abstracts Views on Vision4Press platform.
Data correspond to usage on the plateform after 2015. The current usage metrics is available 48-96 hours after online publication and is updated daily on week days.
Initial download of the metrics may take a while.