Fig. 2
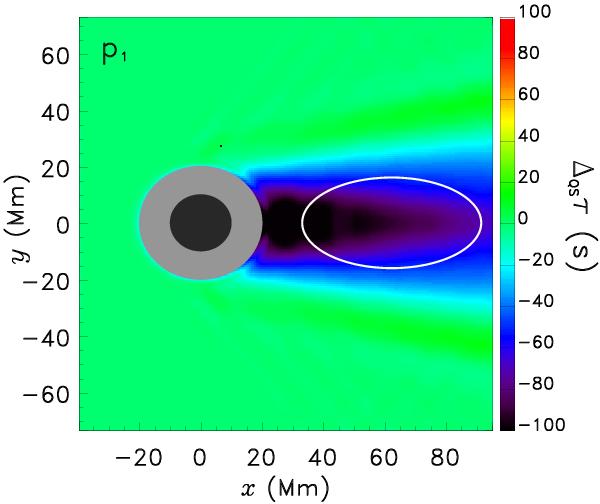
Spatial map of travel-time shifts ΔQSτ of p1 modes through the reference sunspot model. The SLiM code numerically computes the waveform as a function of time through the reference sunspot model. The color bar indicates the travel-time shift in seconds. The ellipse encloses the region for which the spatial average of the travel-time shift (denoted with symbols ⟨ ⟩) is computed. The gray (black) circle indicates the penumbra (umbra) of the sunspot.
Current usage metrics show cumulative count of Article Views (full-text article views including HTML views, PDF and ePub downloads, according to the available data) and Abstracts Views on Vision4Press platform.
Data correspond to usage on the plateform after 2015. The current usage metrics is available 48-96 hours after online publication and is updated daily on week days.
Initial download of the metrics may take a while.