Fig. 1
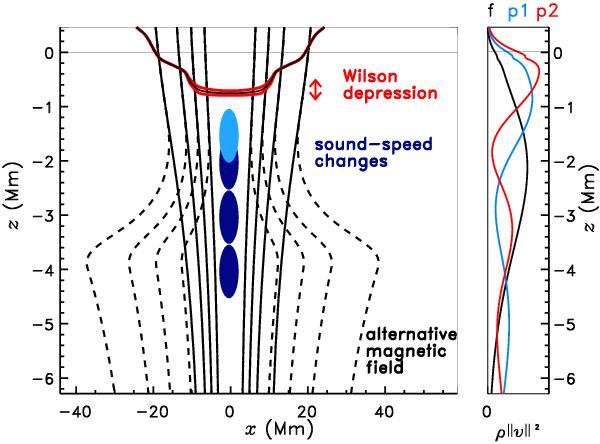
Reference sunspot model and perturbations to it. The magnetic field lines of the reference model are shown by the black curves (Sect. 2.2). The dashed black curves are the magnetic field lines of the alternative magnetic field model (Sect. 2.4). Two Wilson depressions modified by ± 50 km have been considered (red curves, Sect. 2.3). The ellipses along the axis of the sunspot indicate the locations of the various sound-speed perturbations (Sect. 2.5). The size of the ellipses corresponds to the full width at half maximum of the Gaussian perturbations. The uppermost sound-speed perturbation is shown in light blue to be easily distinguished from the perturbation half a megameter below. The right panel shows mode kinetic energy density, ρ ∥ v ∥ 2, for the f mode at kR⊙ = 450 (black), for p1 at kR⊙ = 420 (blue), and for p2 at kR⊙ = 390 (red), where ρ is density and v is the velocity eigenfunction for quiet-Sun model CSM_A. Mode kinetic energy density is a useful indicator of the vertical sensitivity of the modes.
Current usage metrics show cumulative count of Article Views (full-text article views including HTML views, PDF and ePub downloads, according to the available data) and Abstracts Views on Vision4Press platform.
Data correspond to usage on the plateform after 2015. The current usage metrics is available 48-96 hours after online publication and is updated daily on week days.
Initial download of the metrics may take a while.