Fig. 3
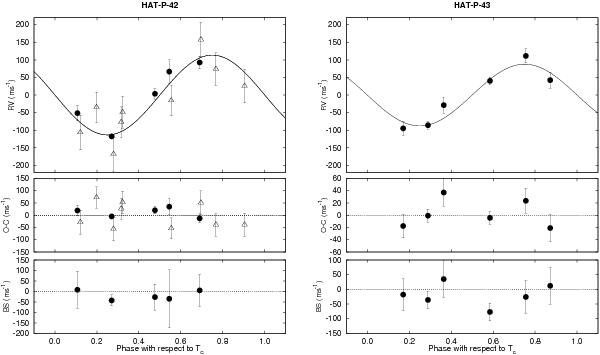
High precision RV measurements and bisector spans (BIS) for HAT-P-42 (left) and HAT-P-43 (right). Filled circles show OHP 1.93 m/SOPHIE observations, while open triangles show FLWO 1.5 m/TRES observations. The top panels show the RV measurements as a function of orbital phase, along with our best-fit circular orbit model. Zero phase corresponds to the time of mid-transit. The center-of-mass velocity has been subtracted for each system. The middle panels show velocity O−C residuals from the best fit circular orbit model. The bottom panels show the BIS values, with the mean values subtracted. Note the different vertical scales of the panels.
Current usage metrics show cumulative count of Article Views (full-text article views including HTML views, PDF and ePub downloads, according to the available data) and Abstracts Views on Vision4Press platform.
Data correspond to usage on the plateform after 2015. The current usage metrics is available 48-96 hours after online publication and is updated daily on week days.
Initial download of the metrics may take a while.