Fig. 2
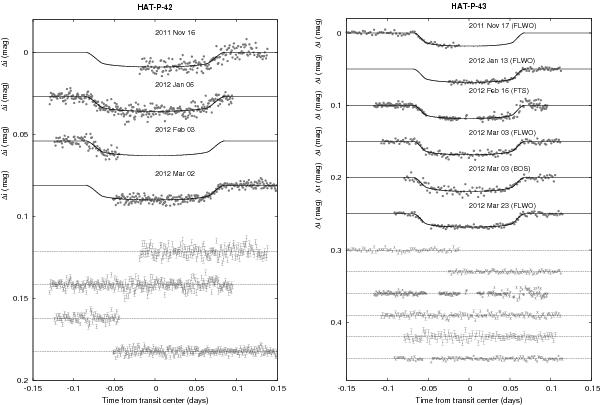
Follow-up light curves for HAT-P-42 (left) and HAT-P-43 (right). For HAT-P-42 all observations were obtained with Keplercam on the FLWO 1.2 m telescope. For HAT-P-43 observations were obtained with Keplercam (indicated by FLWO in the figure), the Spectral CCD on the FTS 2.0 m (FTS), and CCD imager on the BOS 0.8 m (BOS). The Keplercam light curves have been corrected for trends during the modeling. The BOS and FTS light curves have also been corrected for trends, though for these light curves we only apply the external parameter decorrelation (EPD) procedure, and not the Trend Filtering Algorithm (TFA; see Bakos et al. 2010, for details). The dates of the events are indicated. Curves below the top one are displaced vertically for clarity. Our best fit from the global modeling is shown by the solid lines. Residuals from the fits are displayed at the bottom, in the same order as the top curves. The error bars represent the photon and background shot noise, plus the readout noise. They are only plotted on the residuals for readability.
Current usage metrics show cumulative count of Article Views (full-text article views including HTML views, PDF and ePub downloads, according to the available data) and Abstracts Views on Vision4Press platform.
Data correspond to usage on the plateform after 2015. The current usage metrics is available 48-96 hours after online publication and is updated daily on week days.
Initial download of the metrics may take a while.