Fig. 1
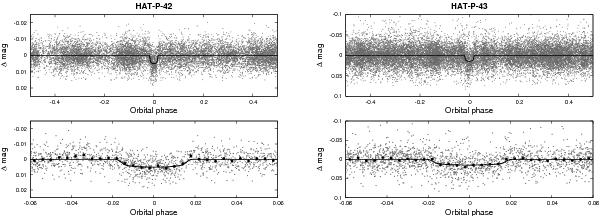
HATNet light curves of HAT-P-42 (left) and HAT-P-43 (right) phase folded with the transit period. In both cases we show two panels: the top shows the unbinned light curve, while the bottom shows the region zoomed-in on the transit, with dark filled circles for the light curve binned in phase with a binsize of 0.002. The solid line shows the model fit to the light curve.
Current usage metrics show cumulative count of Article Views (full-text article views including HTML views, PDF and ePub downloads, according to the available data) and Abstracts Views on Vision4Press platform.
Data correspond to usage on the plateform after 2015. The current usage metrics is available 48-96 hours after online publication and is updated daily on week days.
Initial download of the metrics may take a while.