Fig. 3
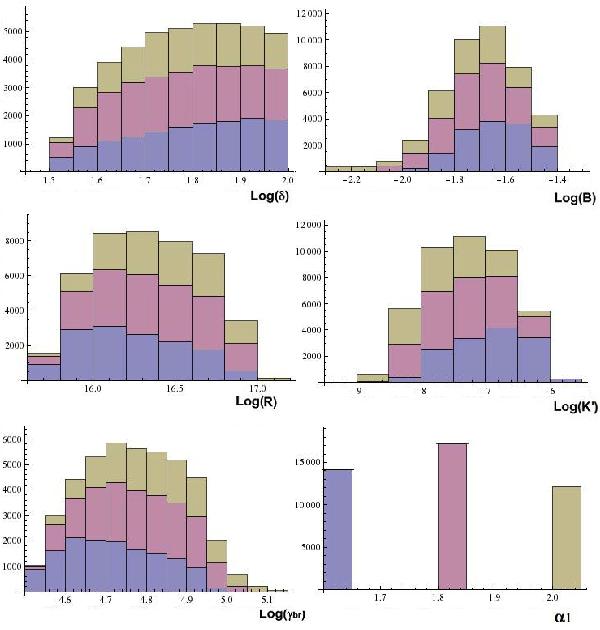
Histograms showing the values of the SSC model parameters for the case of 1RXS J101015.9 - 311909. From top to bottom, and left to right, we show the distribution of the solutions for δ, B (in G), R (in cm), K′ (in cm-3), γbreak, and α1. We note that the value of α1 has been frozen and studied for three different cases (1.6, 1.8, and 2.0). The three colours represent the different solutions for the three values of α1 studied: violet-1.6, pink-1.8, and yellow-2.0.
Current usage metrics show cumulative count of Article Views (full-text article views including HTML views, PDF and ePub downloads, according to the available data) and Abstracts Views on Vision4Press platform.
Data correspond to usage on the plateform after 2015. The current usage metrics is available 48-96 hours after online publication and is updated daily on week days.
Initial download of the metrics may take a while.