Fig. 2
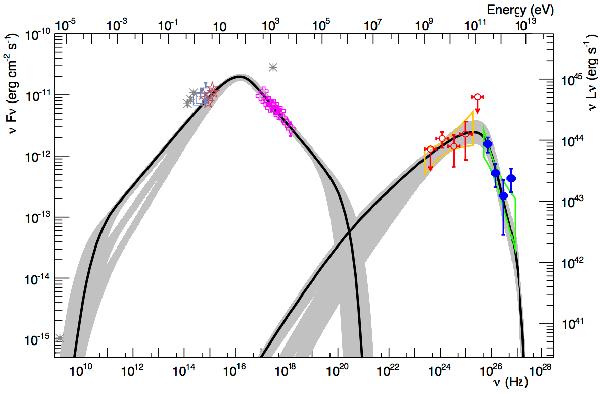
SED of 1RXS J101015.9 - 311909 (Abramowski et al.
2012b, ; the H.E.S.S. spectrum is represented by the green bow-tie and the
blue points, the Fermi-LAT spectrum by the orange bow-tie and the red
empty circles; Swift-XRT data are shown by the pink crosses,
Swift-UVOT data by the red stars, ATOM data by the
blue open boxes, and archival data from the NED in grey). All the SSC models which
describe the SED, as found with our algorithm, are plotted in grey, while the solid
black curve represents the best-fit solution with
 . It is characterised
by an extreme value of δ = 96.83, B = 0.015 G,
R = 1.3 × 1016 cm, α1 = 2.0,
K′ = 8.94 × 10⁻⁸ cm-3, and
γbr = 5.31 × 10⁴. The three different
families of solutions, which can be distinguished in the range between 1011
and 1014 Hz, correspond to α1 = 1.6, 1.8, and
2.0, as discussed in Sect. 3. The infrared and
visible data can be reproduced by taking into account the host-galaxy
contribution.
. It is characterised
by an extreme value of δ = 96.83, B = 0.015 G,
R = 1.3 × 1016 cm, α1 = 2.0,
K′ = 8.94 × 10⁻⁸ cm-3, and
γbr = 5.31 × 10⁴. The three different
families of solutions, which can be distinguished in the range between 1011
and 1014 Hz, correspond to α1 = 1.6, 1.8, and
2.0, as discussed in Sect. 3. The infrared and
visible data can be reproduced by taking into account the host-galaxy
contribution.
Current usage metrics show cumulative count of Article Views (full-text article views including HTML views, PDF and ePub downloads, according to the available data) and Abstracts Views on Vision4Press platform.
Data correspond to usage on the plateform after 2015. The current usage metrics is available 48-96 hours after online publication and is updated daily on week days.
Initial download of the metrics may take a while.