Fig. 6
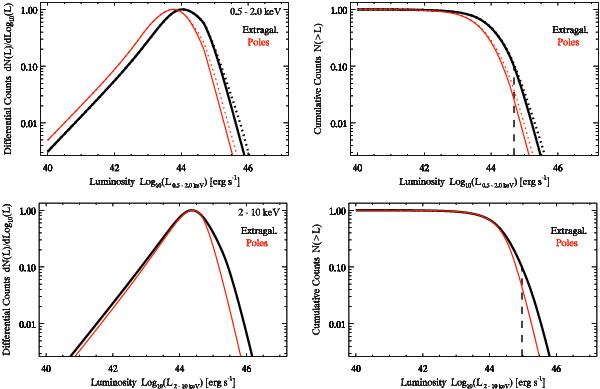
Differential (left) and cumulative (right) luminosity distribution in the soft (top) and the hard (bottom) band for the four-year eRASS AGN sample in the extragalactic sky (black) and at the ecliptic poles only (red). The distributions are normalized to unity to facilitate comparison of the shapes. The dotted curves in the top panels were computed without the high-redshift cutoff in the soft-band XLF (see Sect. 4). The dashed black vertical lines in the right panels show the luminosity corresponding to the 10% fraction of sources.
Current usage metrics show cumulative count of Article Views (full-text article views including HTML views, PDF and ePub downloads, according to the available data) and Abstracts Views on Vision4Press platform.
Data correspond to usage on the plateform after 2015. The current usage metrics is available 48-96 hours after online publication and is updated daily on week days.
Initial download of the metrics may take a while.