Free Access
Fig. 8
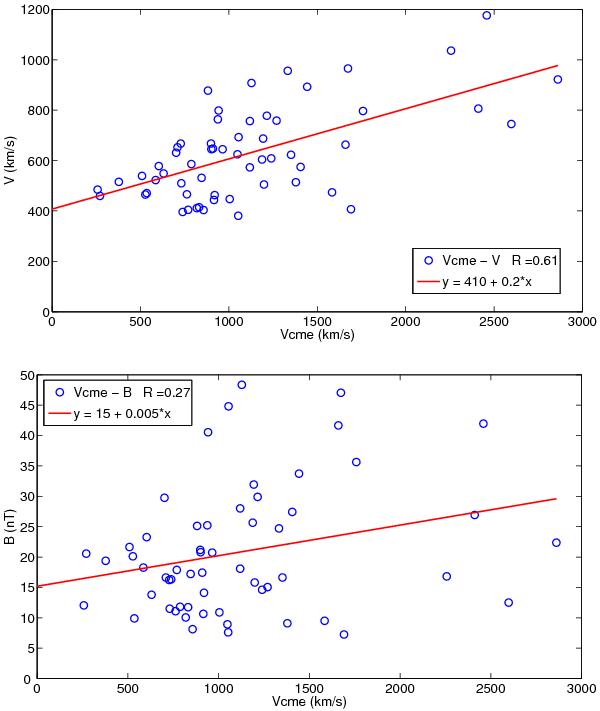
Dependence of ICME peak velocity V (top) and ICME peak magnetic field B (bottom) on the coronagraphic CME mean speed VCME. The linear least-squares fits are shown by the solid lines (parameters and the correlation coefficients R are shown in the insets).
This figure is made of several images, please see below:
Current usage metrics show cumulative count of Article Views (full-text article views including HTML views, PDF and ePub downloads, according to the available data) and Abstracts Views on Vision4Press platform.
Data correspond to usage on the plateform after 2015. The current usage metrics is available 48-96 hours after online publication and is updated daily on week days.
Initial download of the metrics may take a while.