Free Access
Fig. 5
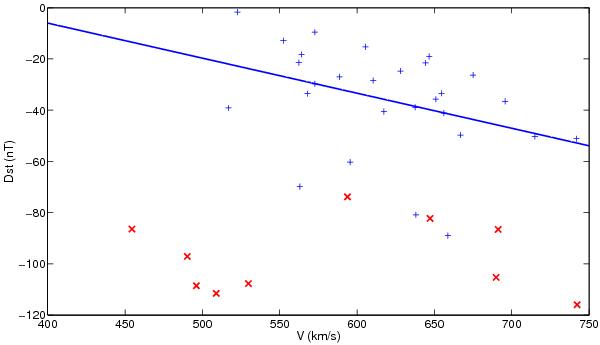
Linear least-squares fit V − Dst for HSS/CIRs. The events from Paper I and Paper II are depicted by the blue pluses (the corresponding linear fit Dst = −0.14V + 49 is shown by blue line), and the events from Zhang et al. (2007a) by red crosses.
Current usage metrics show cumulative count of Article Views (full-text article views including HTML views, PDF and ePub downloads, according to the available data) and Abstracts Views on Vision4Press platform.
Data correspond to usage on the plateform after 2015. The current usage metrics is available 48-96 hours after online publication and is updated daily on week days.
Initial download of the metrics may take a while.