Fig. 7
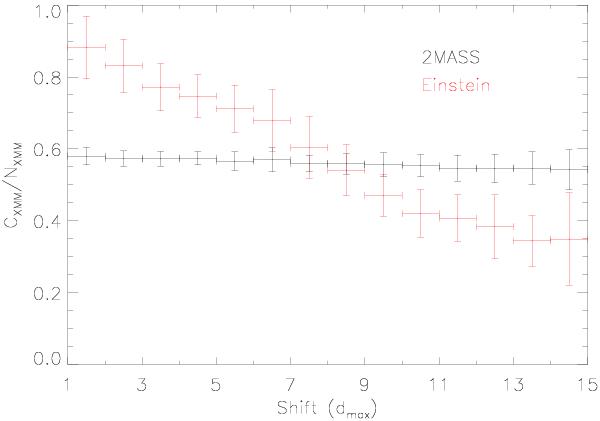
Examples for the chance-correlation dependence on offset. The data points are binned in units of maximal correlation distance (dmax). For each bin, the average of chance-correlation CXMM is given, normalised to the number of correlations NXMM with unshifted coordinates. The error bars give the standard deviation for each bin.
Current usage metrics show cumulative count of Article Views (full-text article views including HTML views, PDF and ePub downloads, according to the available data) and Abstracts Views on Vision4Press platform.
Data correspond to usage on the plateform after 2015. The current usage metrics is available 48-96 hours after online publication and is updated daily on week days.
Initial download of the metrics may take a while.