Fig. 5
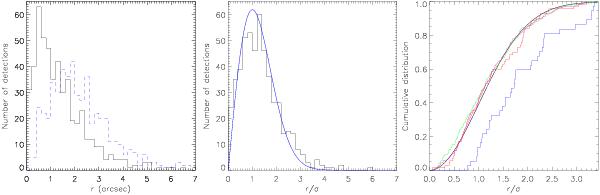
Left: angular separation of X-ray and reference position of identified sources before (dashed blue line) and after (solid black line) boresight correction. Middle: distribution of r/σ, compared with a Rayleigh distribution (blue line). Right: cumulative distribution of angular separation between the XMM-Newton SMC catalogue and the Chandra catalogues of McGowan et al. (2008) in green, Laycock et al. (2010) in red, Nazé et al. (2003) in blue, and Evans et al. (2010) in orange. The cumulative Rayleigh distribution is shown by the black line.
Current usage metrics show cumulative count of Article Views (full-text article views including HTML views, PDF and ePub downloads, according to the available data) and Abstracts Views on Vision4Press platform.
Data correspond to usage on the plateform after 2015. The current usage metrics is available 48-96 hours after online publication and is updated daily on week days.
Initial download of the metrics may take a while.