Fig. 4
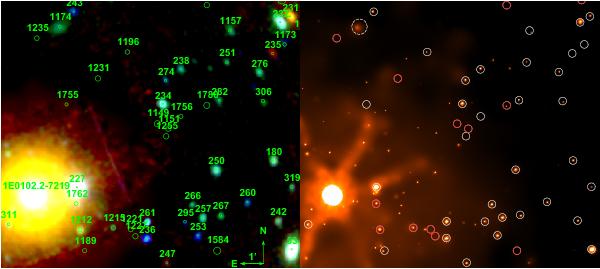
Left: XMM-Newton mosaic image of the deepest field in the SMC overplotted with the point-source catalogue. The image is background subtracted. Colours (red/green/blue) give logarithmically scaled intensities in the (0.2–1.0)/(1.0–2.0)/(2.0–4.5) keV bands. The brightest source is the oxygen-rich SNR 1E0102.2-7219. Right: comparison with a deep Chandra image of the same region. The false-colour image gives logarithmically scaled intensities in the (0.2−10.0) keV band. XMM-Newton sources with low detection likelihood (MLdet < 8) are plotted in red, others in white.
Current usage metrics show cumulative count of Article Views (full-text article views including HTML views, PDF and ePub downloads, according to the available data) and Abstracts Views on Vision4Press platform.
Data correspond to usage on the plateform after 2015. The current usage metrics is available 48-96 hours after online publication and is updated daily on week days.
Initial download of the metrics may take a while.