Fig. 18
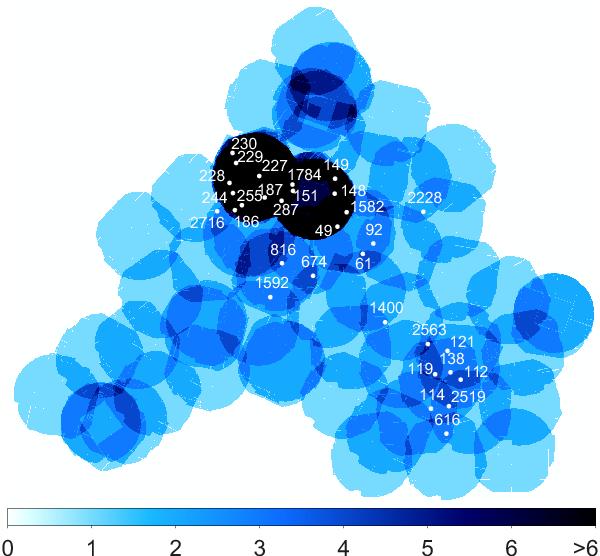
The number of observations per field is compared with the distribution of significant long-term variable sources (V ≥ 10 and S ≥ 3), shown by white dots. Labels give the source numbers. Variable sources are only found in the SMC bar in regions that have been observed several times.
Current usage metrics show cumulative count of Article Views (full-text article views including HTML views, PDF and ePub downloads, according to the available data) and Abstracts Views on Vision4Press platform.
Data correspond to usage on the plateform after 2015. The current usage metrics is available 48-96 hours after online publication and is updated daily on week days.
Initial download of the metrics may take a while.