Fig. 15
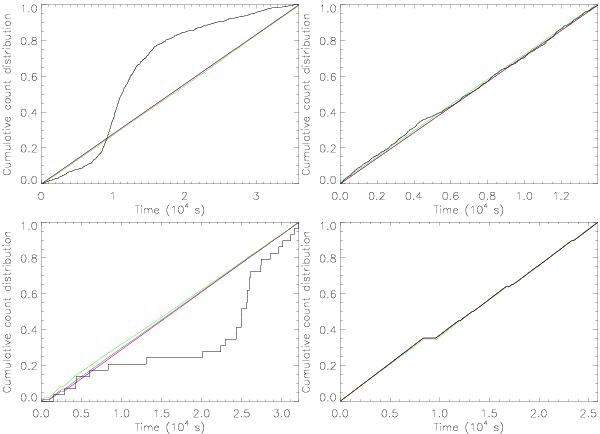
Cumulative photon arrival time distributions as used for the KS tests. Source counts are plotted in black, the background light curve is shown in green. The distribution, expected from a constant source is shown in blue and the reference distribution in red. In case of a constant source and background light curve, all lines are blended. The source-count distribution of variable sources is significantly different from the expected distribution. Upper left: the bright foreground star N°2041. Lower left: the foreground star candidate N°255. Upper right: the HMXB RX J0054.9-7245 (N°335). Lower right: the SNR 1E0102.2-7219.
Current usage metrics show cumulative count of Article Views (full-text article views including HTML views, PDF and ePub downloads, according to the available data) and Abstracts Views on Vision4Press platform.
Data correspond to usage on the plateform after 2015. The current usage metrics is available 48-96 hours after online publication and is updated daily on week days.
Initial download of the metrics may take a while.