Fig. 13
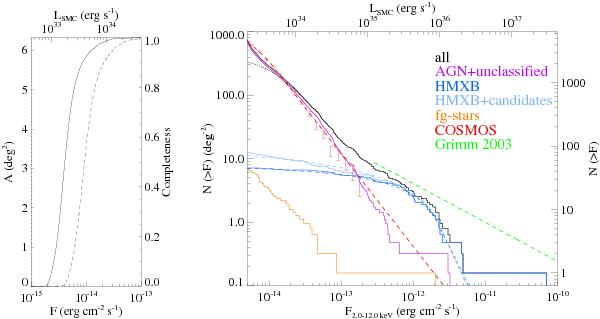
Left: sky coverage as function of flux is shown for the (0.2−12.0) keV and (2.0−12.0) keV band by the solid and dashed line, respectively. Right: cumulative luminosity function for sources and their classification in our catalogue (solid lines) and according models (dashed lines) as described in Sect. 7.2.
Current usage metrics show cumulative count of Article Views (full-text article views including HTML views, PDF and ePub downloads, according to the available data) and Abstracts Views on Vision4Press platform.
Data correspond to usage on the plateform after 2015. The current usage metrics is available 48-96 hours after online publication and is updated daily on week days.
Initial download of the metrics may take a while.