Free Access
Fig. 12
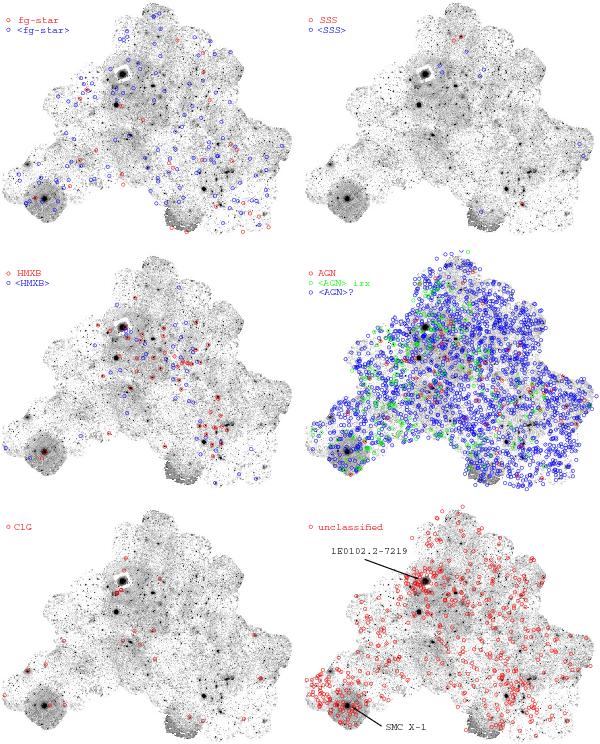
Spatial distribution of identified and classified X-ray sources in the SMC main field. The underlying mosaic image shows logarithmically scaled intensities in the (0.2−4.5) keV band. North is up, east is left.
Current usage metrics show cumulative count of Article Views (full-text article views including HTML views, PDF and ePub downloads, according to the available data) and Abstracts Views on Vision4Press platform.
Data correspond to usage on the plateform after 2015. The current usage metrics is available 48-96 hours after online publication and is updated daily on week days.
Initial download of the metrics may take a while.