Fig. 5
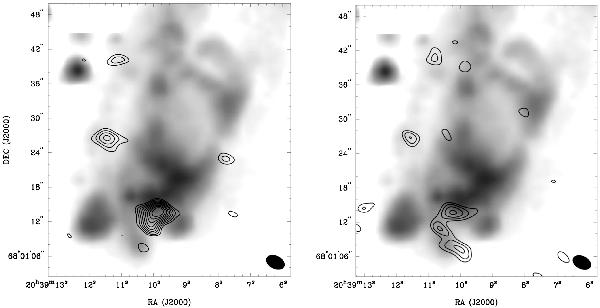
SiO(5–4) emission in the blue lobe of the L1157 outflow integrated in two velocity ranges. The high-velocity range (left panel) is integrated from –16.7 to –6.3 km s-1, the low-velocity range (right panel) from –6.3 to +4.1 km s-1. The velocity range is indicated in the upper left corner of each panel. Contours start at 3σ and are then separated by steps of 1σ (σ = 0.985 Jy beam-1 km s-1). The grayscale represents the 4.5 μm emission from Spitzer/IRAC.
Current usage metrics show cumulative count of Article Views (full-text article views including HTML views, PDF and ePub downloads, according to the available data) and Abstracts Views on Vision4Press platform.
Data correspond to usage on the plateform after 2015. The current usage metrics is available 48-96 hours after online publication and is updated daily on week days.
Initial download of the metrics may take a while.