Fig. 4
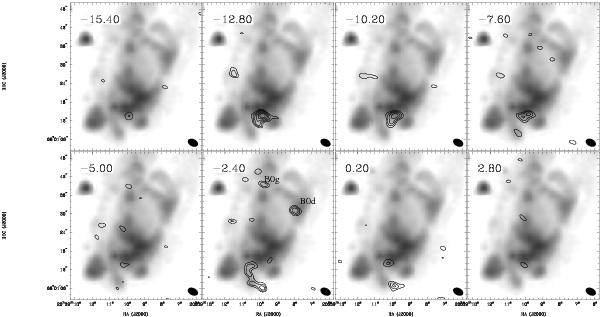
SiO (5–4) emission (contours) in channel maps of 2.6 km s-1 width, overlaid on the 4.5 μm emission from Spitzer/IRAC. SiO contours start at 3σ (σ = 0.188 Jy beam-1) and are then separated by steps of 1σ up to a value of 8σ. The central velocity of each channel map is indicated in the upper left corner, while the ellipse in the lower right corner shows the synthesized beam.
Current usage metrics show cumulative count of Article Views (full-text article views including HTML views, PDF and ePub downloads, according to the available data) and Abstracts Views on Vision4Press platform.
Data correspond to usage on the plateform after 2015. The current usage metrics is available 48-96 hours after online publication and is updated daily on week days.
Initial download of the metrics may take a while.