Fig. 13
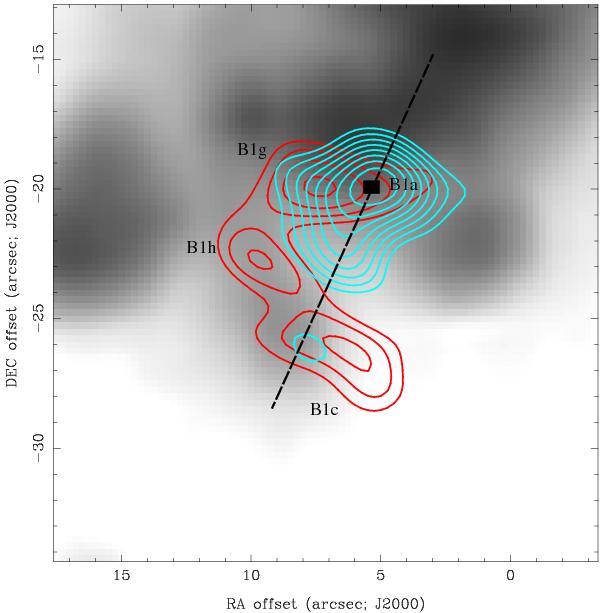
Low-velocity (red contours) and high-velocity (cyan contours) SiO(5–4) emission at the B1 position, overlaid on the 4.5 μm emission from Spitzer/IRAC. The dashed line indicates the axis (PA of 161 degrees) of the inner cavity identified in the CO (1–0) by Gueth et al. (1996). The PV diagram in Fig. 14 was made along this cut. The black square shows the reference position (offset = 0) of the PV diagram in Fig. 14.
Current usage metrics show cumulative count of Article Views (full-text article views including HTML views, PDF and ePub downloads, according to the available data) and Abstracts Views on Vision4Press platform.
Data correspond to usage on the plateform after 2015. The current usage metrics is available 48-96 hours after online publication and is updated daily on week days.
Initial download of the metrics may take a while.