Fig. 11
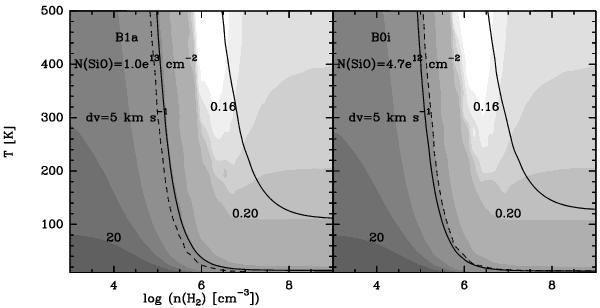
SiO (2–1)/(5–4) ratio as a function of Tkin and n(H2) from the LVG modeling (grayscale). The panels show B1a and B0i cases. The observed line ratios (1.7 at B1a and 1.0 at B0i) are shown as a dashed curve, while the SiO (5–4) intensities (4.4 and 1.5 K km s-1, for B1a and B0i, respectively) are represented by the solid lines. The line ratios plotted in gray are 0.16, 0.17 0.18, 0.2, 0.5, 1, 5, 10, 20 (some of them indicated with numbers).
Current usage metrics show cumulative count of Article Views (full-text article views including HTML views, PDF and ePub downloads, according to the available data) and Abstracts Views on Vision4Press platform.
Data correspond to usage on the plateform after 2015. The current usage metrics is available 48-96 hours after online publication and is updated daily on week days.
Initial download of the metrics may take a while.