Fig. 2
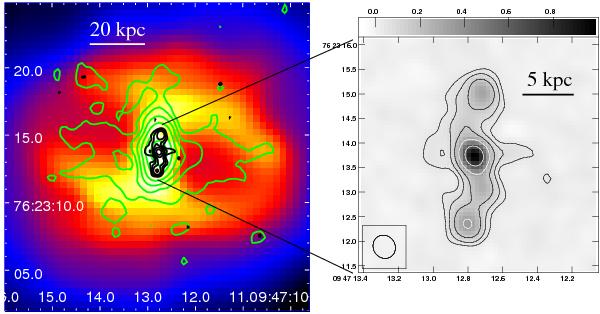
The 4.8 GHz VLA contours obtained from the combined A- and B-array archival observations of RBS 797, imaged at different resolutions, are overlaid onto the Chandra image of the central region of the cluster (left panel). Green contours: 4.8 GHz VLA map at  resolution, obtained by setting ROBUST=+5, UVTAPER=250; the rms noise is 0.01 mJy beam-1 and the contour levels are 0.03, 0.06, 0.12, 0.24, 0.48, and 0.96 mJy beam-1; the total flux density is ~4 mJy, with a peak flux density of 1.5 mJy beam-1. Black contours (best visible in the zoom in the right panel): 4.8 GHz VLA map at
  resolution, obtained by setting ROBUST=0, UVTAPER=0; the rms noise is 0.01 mJy beam-1 and the contour levels are 0.04, 0.08, 0.16, 0.32, and 0.64 mJy beam-1; the total flux density is ~2.8 mJy, with a peak flux density of 1.0 mJy beam-1.
Current usage metrics show cumulative count of Article Views (full-text article views including HTML views, PDF and ePub downloads, according to the available data) and Abstracts Views on Vision4Press platform.
Data correspond to usage on the plateform after 2015. The current usage metrics is available 48-96 hours after online publication and is updated daily on week days.
Initial download of the metrics may take a while.