Fig. 5
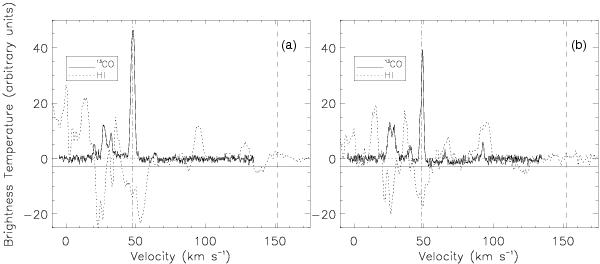
The 13CO and HI 21 cm spectra toward a) clump A and b) clump B embedded in the continuum emission from the SNR G15.4+0.1. The vertical dash-doted line indicates the central velocities of each clump, while the tangent point velocity is marked by a vertical dashed line. The solid horizontal line represents the error of about 2.8 K in the HI 21 cm absorption spectrum.
Current usage metrics show cumulative count of Article Views (full-text article views including HTML views, PDF and ePub downloads, according to the available data) and Abstracts Views on Vision4Press platform.
Data correspond to usage on the plateform after 2015. The current usage metrics is available 48-96 hours after online publication and is updated daily on week days.
Initial download of the metrics may take a while.